
 0 saved
 34.8K views


The so-called 'Sports Illustrated curse' was the belief that successful sports teams that were featured on the cover of the magazine, would quickly fail or underperform straight afterwards. The data seemed to back this view up... only, it wasn't a curse, it was the result of a logical fallacy relating to the Regression to the Mean.
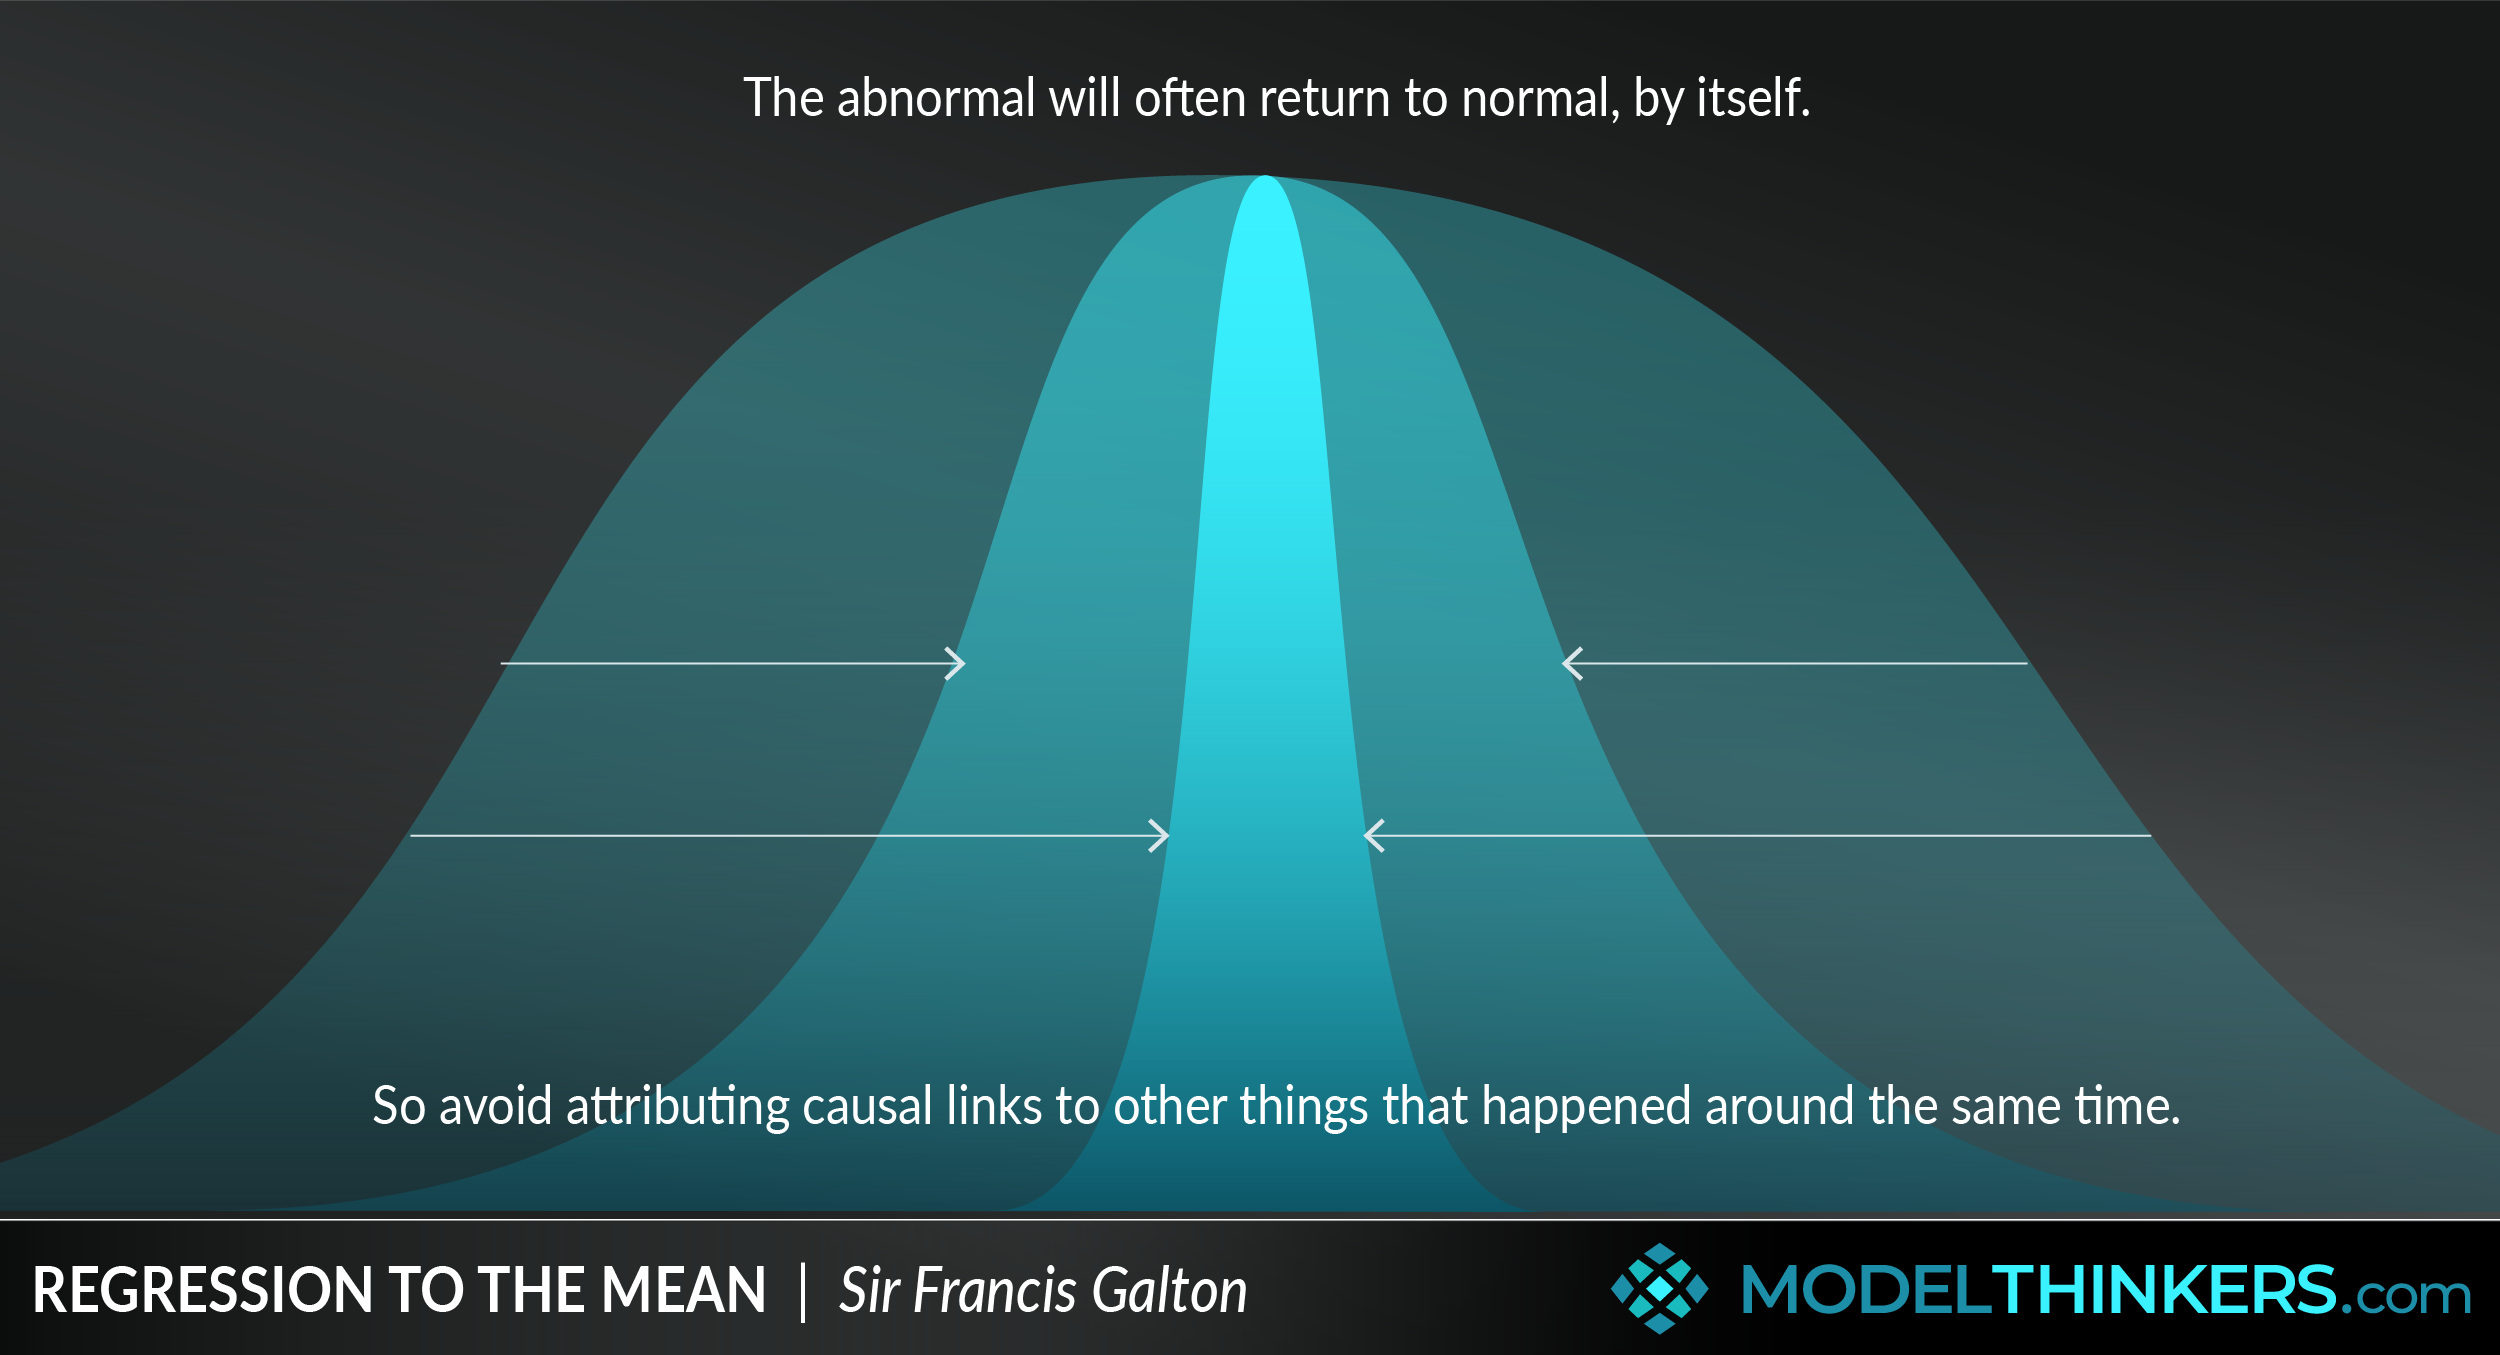
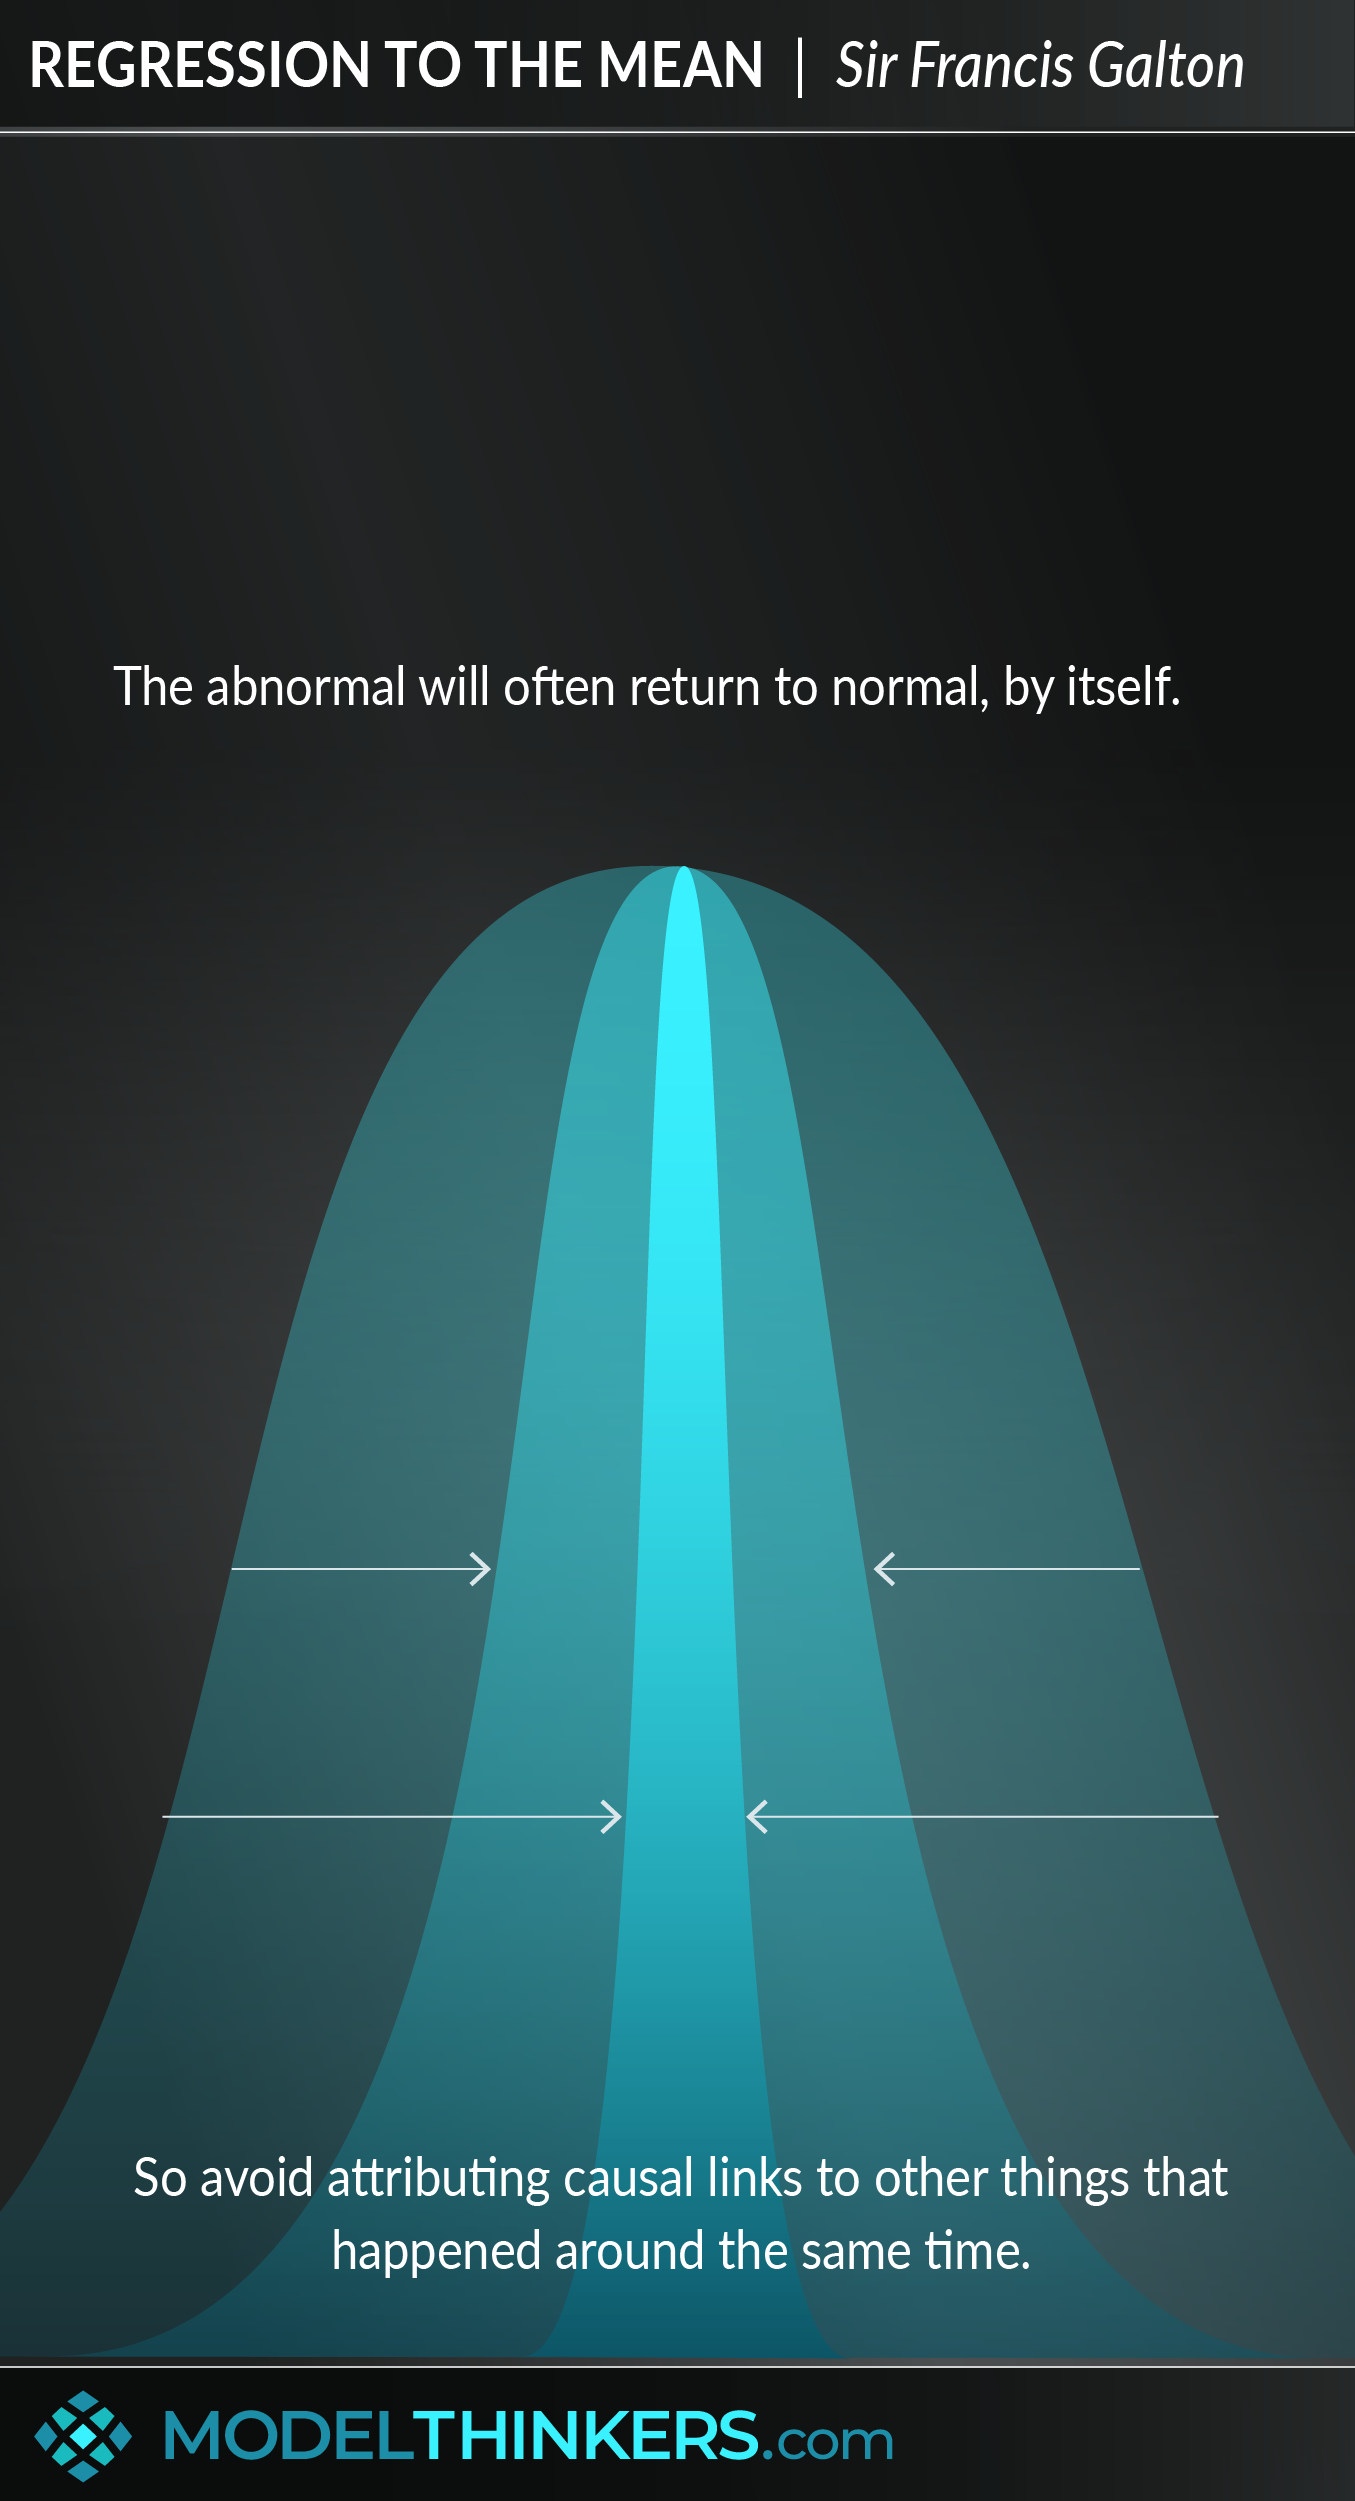
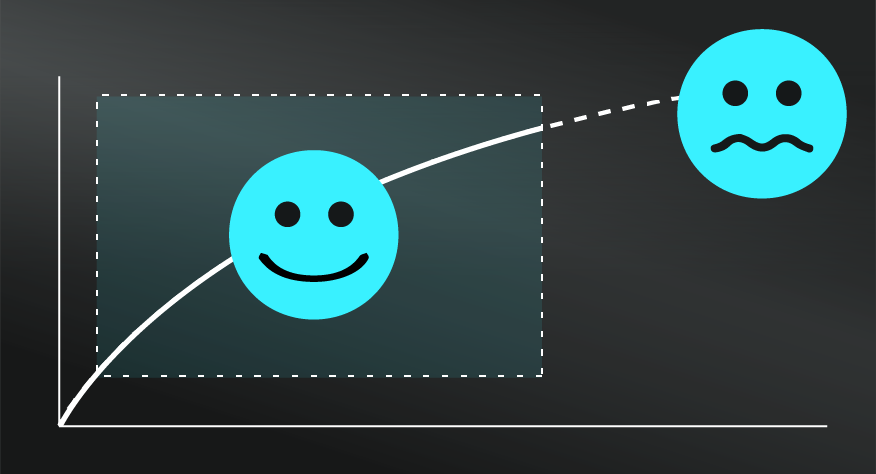
Regression to the Mean is a statistical term describing how extreme results, where luck is a major factor, will tend to return closer to the average over time.
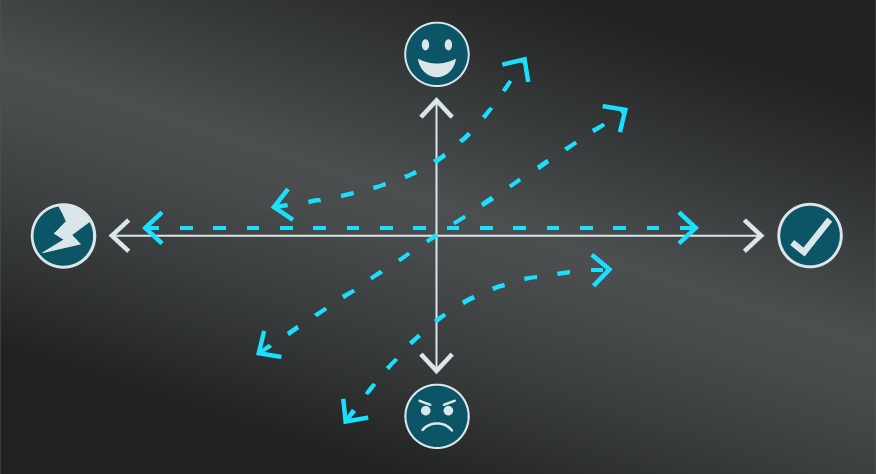
EXTREMES MIGHT JUST BE EXCEPTIONS.
Also known as Reversion Towards the Mean, this model is a warning that extremely good or bad results, which are primarily based on luck, will tend not to happen for an extended period of time. On a practical level, understanding and applying Regression to the Mean helps you to counter the Causal Fallacy, or your tendency to attribute false causal factors or patterns to an initial extreme result.
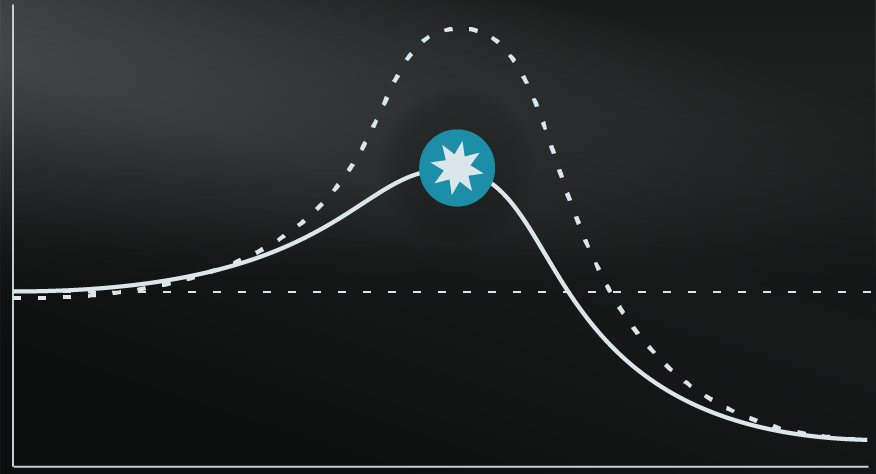
So, if you see an extreme result in sports, politics or business results you might look for reasons and falsely assume a causal relationship. You'd typically assume that key people have developed skill or knowledge that has driven those better results.
This is reasonable, indeed many activities require a combination of skill and luck, so you might be right. But, if the result was more about luck, it’s just an anomaly that will soon return to something closer to the average.
THE SPORTS ILLUSTRATED CURSE EXPLAINED.
Back to the Sports Illustrated curse, it turns out that teams or players who had great success were then featured on the cover. However, their extreme results were anomalies and quickly Regressed to the Mean — which was interpreted as a causal relationship between being profiled on the cover and underperforming.
You'll see this fallacy applied to other cases where Regression to the Mean is at play — see the In Practice section below for the story of Kahneman and flight cadets, or simply look around you at the initial analysis of any extreme results.
IN YOUR LATTICEWORK.
Regression to the Mean is part of statistics, data and probability fields, though can be applied more broadly. It's definitely worthwhile digging into Correlation versus Causation to understand the Causal Fallacy and, while you're there, explore how Nicholas Cage movies make people drown.
You might want to dig deeper into possible causal relationships using the 5 Whys and/or the Fishbone Diagram. Other models that might assist you to avoid this fallacy include First Principle Thinking, to challenge your assumption; the Scientific Method, to run effective experiments and test the hypothesis of causal relationships; and Probabilistic Thinking, to develop a more dynamic view of a complex world.
- Remain sceptical of extreme results.
Assuming the reversion to the mean will be at play helps you to ‘stay the course’ through extreme positive or negative results. Consider this in gambling, investment and in business.
- Remain sceptical of small data sets.
Small data sets will be more susceptible to extremes that revert to the mean. Before assuming a pattern, look for larger data sets or wait to generate such data sets.
- Remain sceptical of beginners' luck.
Taking the above two points, this one perhaps could be left unsaid - but I’ll say it anyway. An extremely positive starting point at anything represents both an extreme result and a small data set. It’s more likely going to proceed with regression to the mean than reflect an extraordinary talent, though there are always such exceptions.
- Consider Correlation versus Causation.
It’s tempting to point to a factor that happened before the extreme result and assume a causal relationship. Applying this model could explain the extreme result as luck, with only correlation or coincidence linking it to the factor (see in practice below for examples). Such links can be further explored with Split Tests.
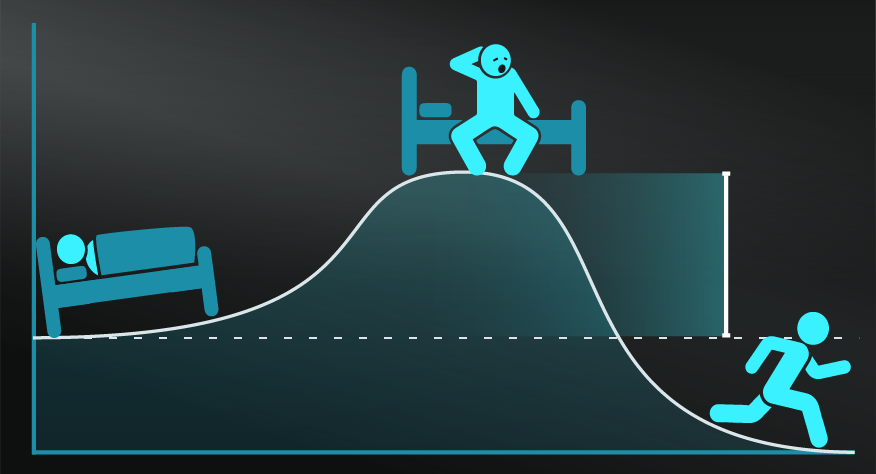
- Expect periods of personal success to be followed by failure.
Sometimes practising some actions, will rely on luck as much as skill, will return a rollercoaster ride. So if you achieve some extreme success, it’s likely that you will experience Regression to the Mean and also hit some level of ‘failure’ in the same activity moving forward. Focus more on your overall trajectory.
The main limitation of Regression to the Mean is when it’s applied to the wrong situations. The ‘wrong’ situations are when, rather than luck, there are other causal factors at play and a pattern may indeed be emerging. The sports player may indeed have mastered a new technique, the business might have hit critical mass for their marketing campaign.
The curse of the Sports Illustrated cover.
For a time, people believed that sports teams or players who featured on the cover of Sports Illustrated were cursed. It seemed that after they appeared on the cover they would perform badly or at least not up to expectations. There was some data behind this — the magazine itself studied 2,456 covers and found that there was a ‘jinx rate’ of 37% which led them to conclude that something significant was happening. It was explained away based on participants becoming overconfident or under increased pressure.
However, this was an example of reversion to the mean. When an athlete had a particularly good game or performed an amazing feat, it was no wonder that Sports Illustrated wanted to feature them. However, if that achievement was more from luck rather than an increase in skill, then it would not be sustainable or part of a pattern. The next game, when they played closer to their average, the correlation of being on the cover of a magazine was seen as causal.
Flight cadets and feedback.
Daniel Kahneman identified a similar example to the above with flight cadets. Cadets who achieved well, effectively executing an aerobatic manoeuvre, were given positive feedback, only to perform worse in their next flight. The assumption was that positive feedback caused negative results — even though this went against conventional wisdom. Instead, as Kahneman explained, it was more likely explained as Regression to the Mean.
Regression to the mean is part of statistics, data and probability fields, though can be applied more broadly.
Use the following examples of connected and complementary models to weave reversion to the mean into your broader latticework of mental models. Alternatively, discover your own connections by exploring the category list above.
Connected models:
- Probabilistic thinking: having a more complex view on likely causal relationships and potential patterns.
- Correlation vs causation: understanding the difference and that regression to the mean might expose more correlation over causation.
Complementary models:
- Confirmation bias: using regression to the mean can prevent confirmation bias in assuming causal relationships and patterns.
- Anchoring bias: combining these models can interrupt the bias of over playing initial results and expecting closer to average results moving forward.
The mental model of regression first arose in biology and genetics and was coined by Sir Francis Galton, a cousin of Charles Darwin, inventor of the silent dog whistle and author of three books on fingerprints in forensic science (no, none of that is relevant but it’s damn interesting right?).
Galton collected height data on over 1,000 of adult sons and their fathers. He discovered that heights tended to regress to the mean, in other words, that “tall fathers will have, on average shorter sons, and short fathers will have, on average, taller sons.”
Daniel Kahneman, of behavioural economics and thinking fast and slow fame, continued applying and demonstrating this model in a range of contexts, one example of which is cited in the in practice section above.
 My Notes
Oops, That’s Members’ Only!
Fortunately, it only costs US$5/month to Join ModelThinkers and access everything so that you can rapidly discover, learn, and apply the world’s most powerful ideas.
ModelThinkers membership at a glance:

“Yeah, we hate pop ups too. But we wanted to let you know that, with ModelThinkers, we’re making it easier for you to adapt, innovate and create value. We hope you’ll join us and the growing community of ModelThinkers today.”
You Might Also Like:
- Actionable summaries of the world's most powerful ideas.


Subscribe now and download this practical guide to transform your thinking, plus recieve one short, powerful and actionable idea in your inbox each month.