 0 saved
 18.8K views


This model is used for strategic planning and weigh up growth opportunities by prioritising product initiatives.
The BCG Growth-Share Matrix is a simple framework to assess and prioritise a company's product lines based on their level of growth versus market share.
THE FOUR QUADRANTS.
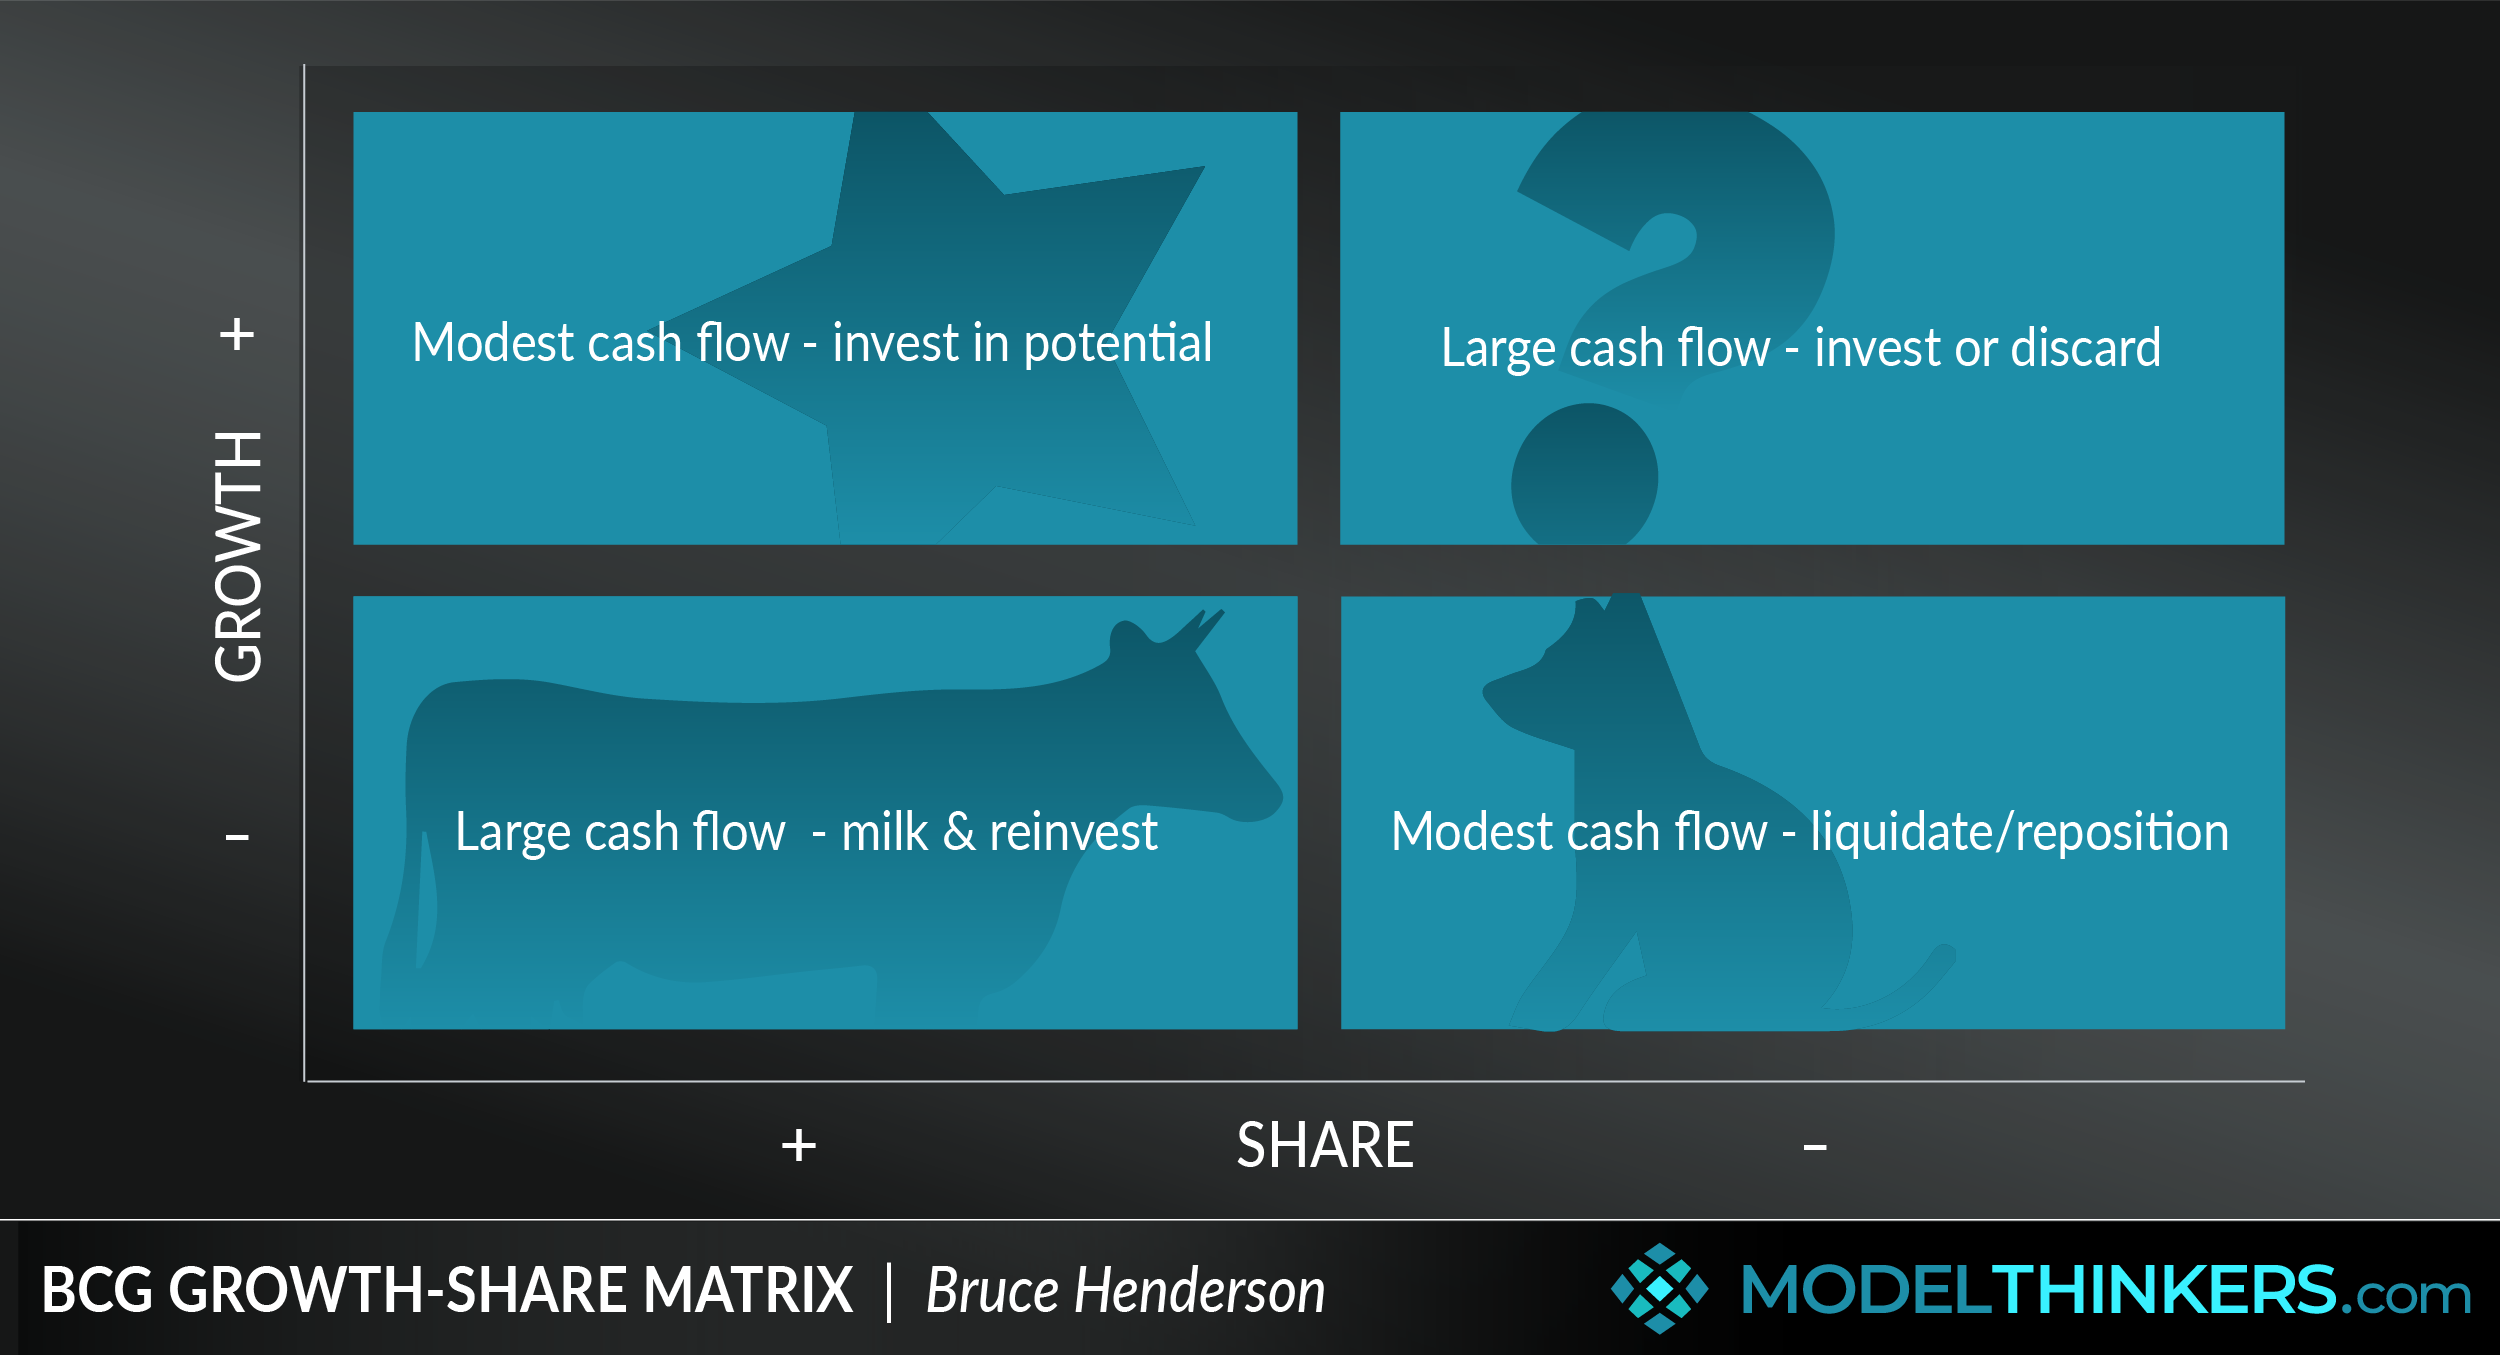
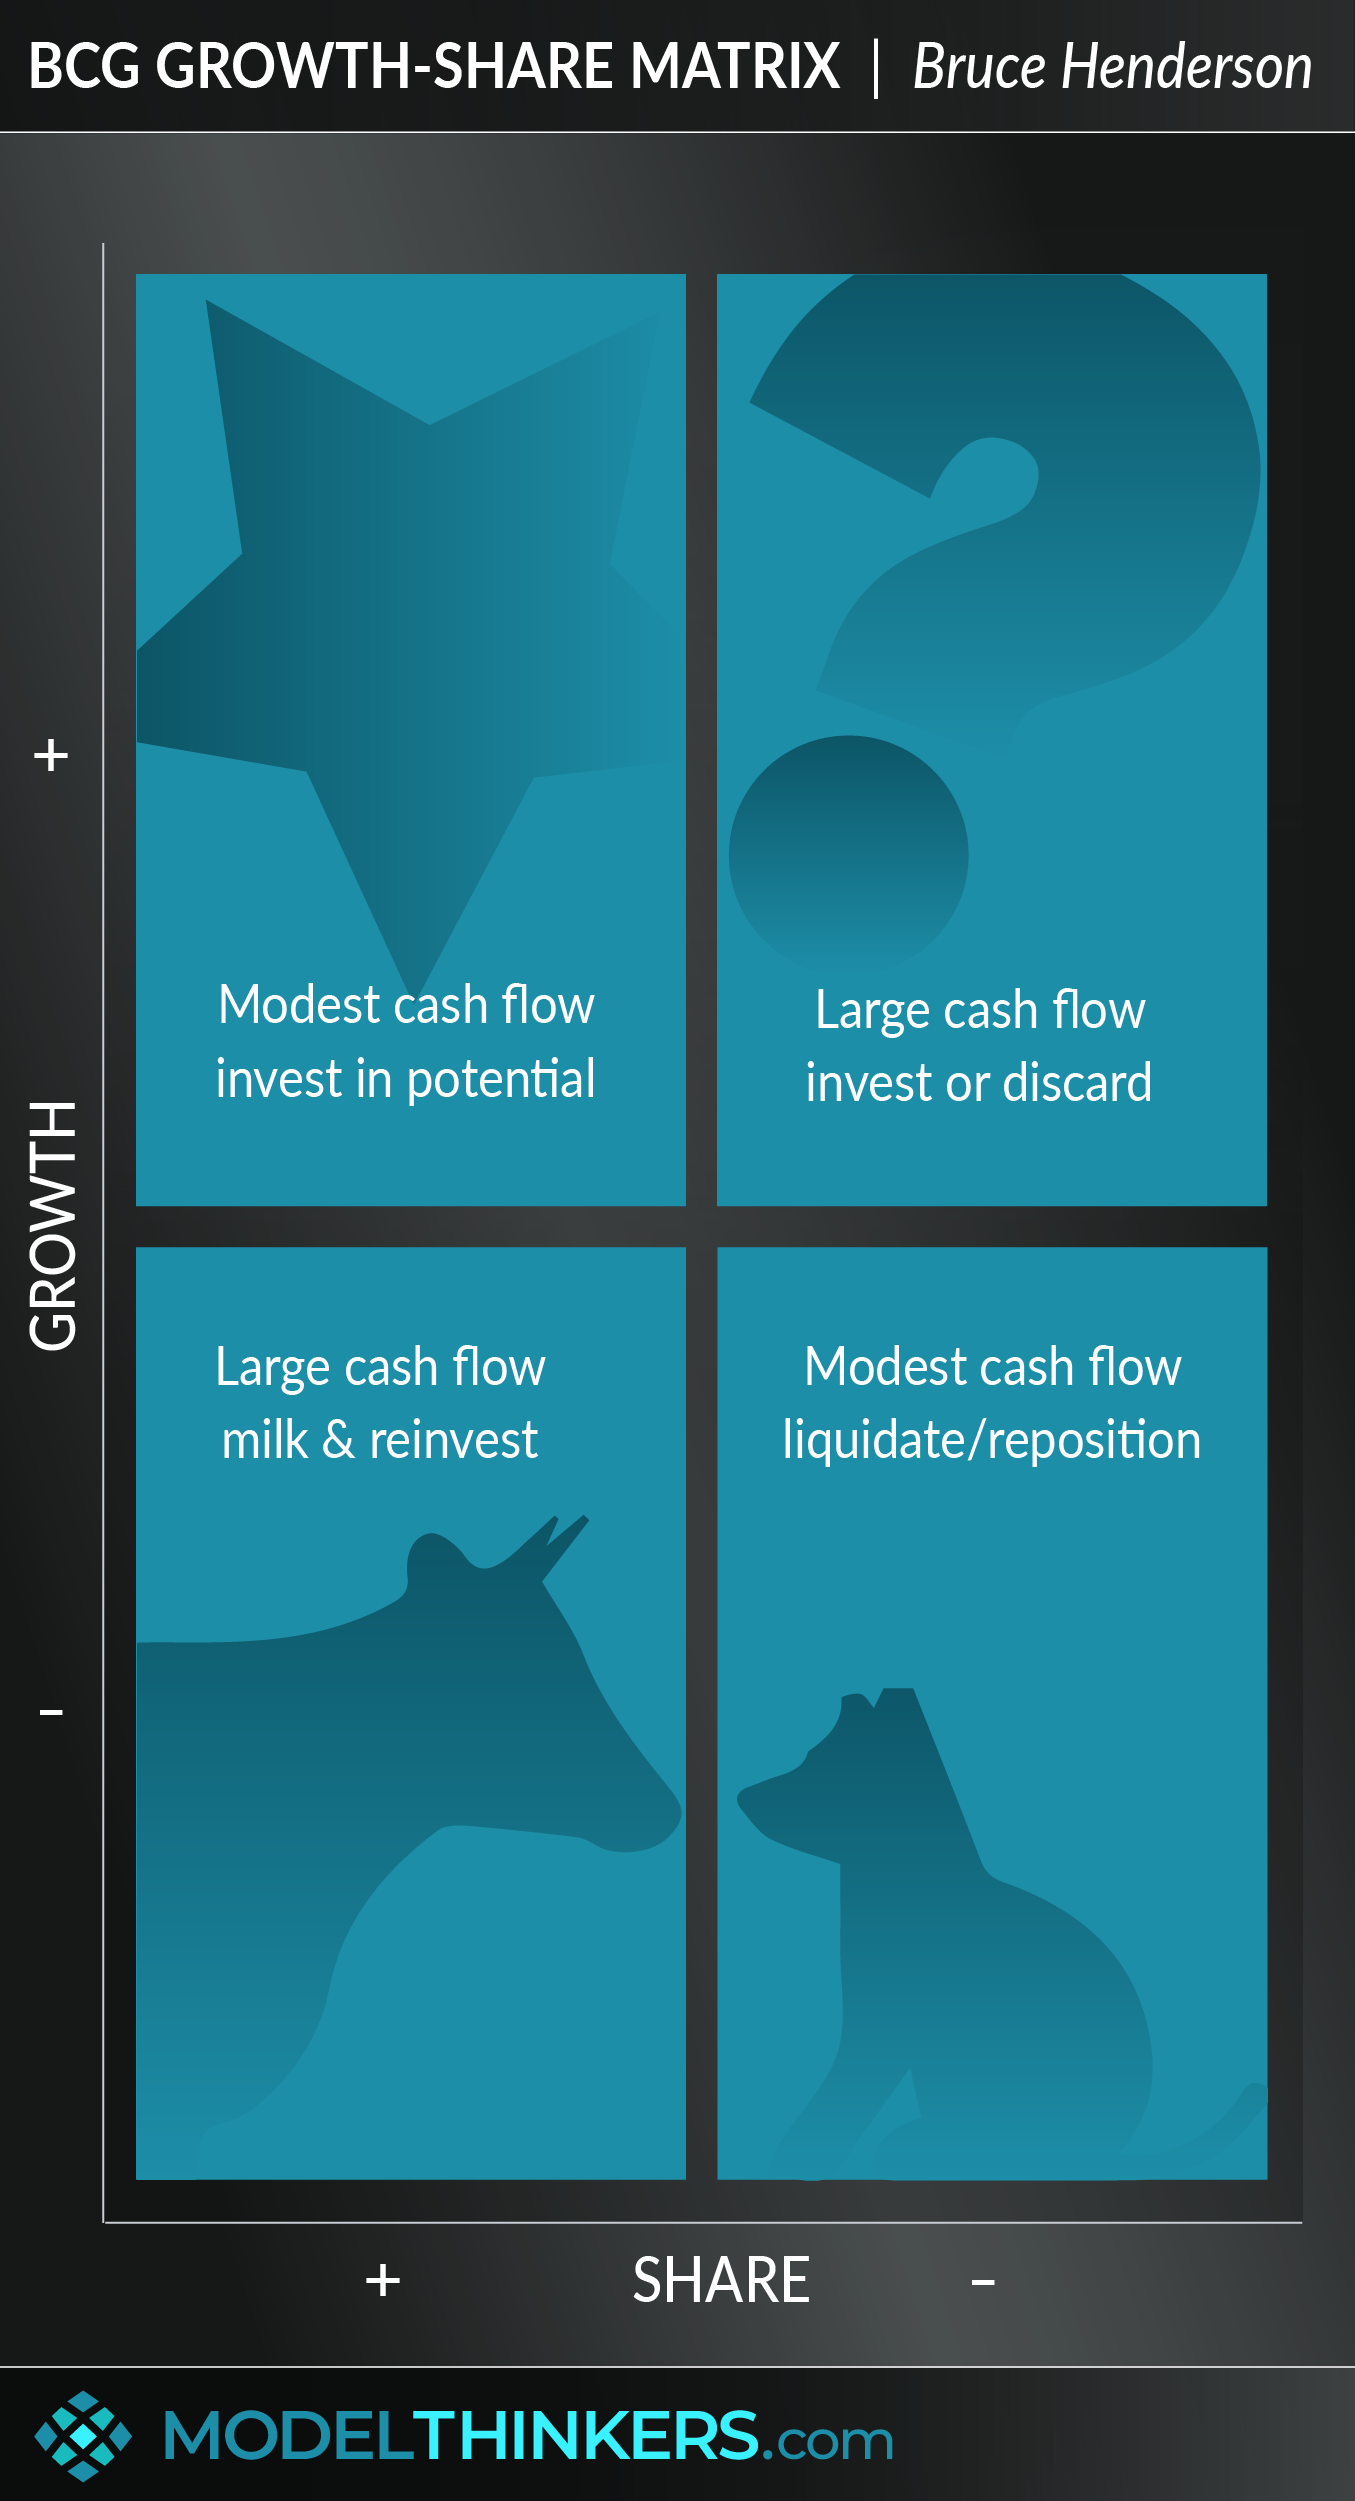
This framework assigns each business unit in a corporation to one of the four quadrants in a chart:
- Cash cows: low growth and high share, they should be ‘milked’ for cash to reinvest.
- Stars: high growth and high share, with high potential and worthy of investment.
- Question marks: high growth and low share, choose to invest or discard.
- Pets have both low share and growth and should be liquidated or repositioned.
The BCG Growth-Share Matrix reveals that product value is influenced by the company's ability to obtain a leading share before growth slows down and that all products eventually become either cash cows or pets.
IN YOUR LATTICEWORK.
Alternative names for this model include the Boston Matrix; the Boston Consulting Group analysis; and the Boston box and it remains an important tool to support companies to strategically manage cash flow. A more complex, perhaps more robust alternative, is the GE McKinsey Nine Box Matrix.
Other related models include Cost-Benefit Analysis to help establish where products fall on the grid; Diversitifcation to take a strategic view of products, and the Opportunity Cost to weigh up alternative investments.


- Use the matrix to navigate product lifecycle
Applying this framework is an ongoing process that understands that products have a lifecycle and their position in your portfolio will shift over time.
- Build a diversified portfolio
A company should ideally have a portfolio of products with different growth rates and market shares. This allows you to balance your cash flow, as high growth products (stars) need input to grow, input obtained from low growth products that generate excess cash (cash cows).
- Use cash cows to fund stars and question marks
Cash cows can be milked continuously with minimum investment and should be used to fund stars and question marks, which are likely to become cash cows in the future. Investing in these business units is a waste as they are part of a mature market with low growth.
- Keep an eye on your stars
Having a high growth rate and not maintaining a large market share means that stars consume large amounts of company resources. They can transform into cash cows if they remain among market leaders when industry growth slows or they can become dogs if their market share stays low.
- Strive to convert question marks into stars
When market growth declines, question marks degenerate to dogs. Added funds will transform your question marks into stars, thus ensuring a balanced portfolio along with cash cows supplying funds for future growth, and stars using the excess cash.
The BCG Growth-Share Matrix does not account for external factors that can alter a product's performance, including disruptive products entering the market, and shifts in consumer demand.
The strategy of milking cash cows and using those funds to support other product lines is considered erroneous by some marketing experts as this strategy could jeopardise the position of these highly-successful product lines.
Moreover, this cash flow technique is not considered applicable to all situations and could cause misleading results in some cases. A famous example contradicting the BCG Growth-Share Matrix is that of the BIC razor blades, which fall into the category of dogs (low market share, low growth) and yet are profitable by retaining a significant market and having a selling price almost 50 times larger than their production cost.
Samsung.
Samsung spreads risk among a large variety of business units including cameras, TVs, microwaves, refrigerators, laundry machines, and even chemicals and insurances. The company uses the BCG Growth-Share Matrix to decide how to allocate resources to each business division.
The BCG growth-share matrix supports companies to strategically manage cash flow.
Use the following examples of connected and complementary models to weave the BCG growth-share matrix into your broader latticework of mental models. Alternatively, discover your own connections by exploring the category list above.
Connected models:
- GE McKinsey nine box matrix: developed with the intention of taking a more robust approach to business unit analysis.
- Cost-benefit analysis: in analysing where products fall on the matrix.
- Opportunity cost: in considering alternative investment options.
- Diversification and redundancy/ margins of safety: to take a broader view of the potential role products and business units.
Complementary models:
- Balanced scorecard: to assess the overall health of a company, rather than particular product lines in isolation.
- Pareto principle: in assessing which products units are delivering key value.
- The golden circle: aligning products to your ‘why’.
Alternative names for this model include: the Boston Matrix; the Boston Consulting Group analysis; the growth-share matrix; the Boston box; the product portfolio matrix.
The BCG Growth-Share Matrix was created by Bruce D. Henderson for the Boston Consulting Group in 1970 and is still used as an analytical tool in brand marketing, strategic management, product management, and portfolio analysis. Find out more about the model from the BCG website here.
 My Notes
Oops, That’s Members’ Only!
Fortunately, it only costs US$5/month to Join ModelThinkers and access everything so that you can rapidly discover, learn, and apply the world’s most powerful ideas.
ModelThinkers membership at a glance:


“Yeah, we hate pop ups too. But we wanted to let you know that, with ModelThinkers, we’re making it easier for you to adapt, innovate and create value. We hope you’ll join us and the growing community of ModelThinkers today.”


