
 0 saved
 38.3K views


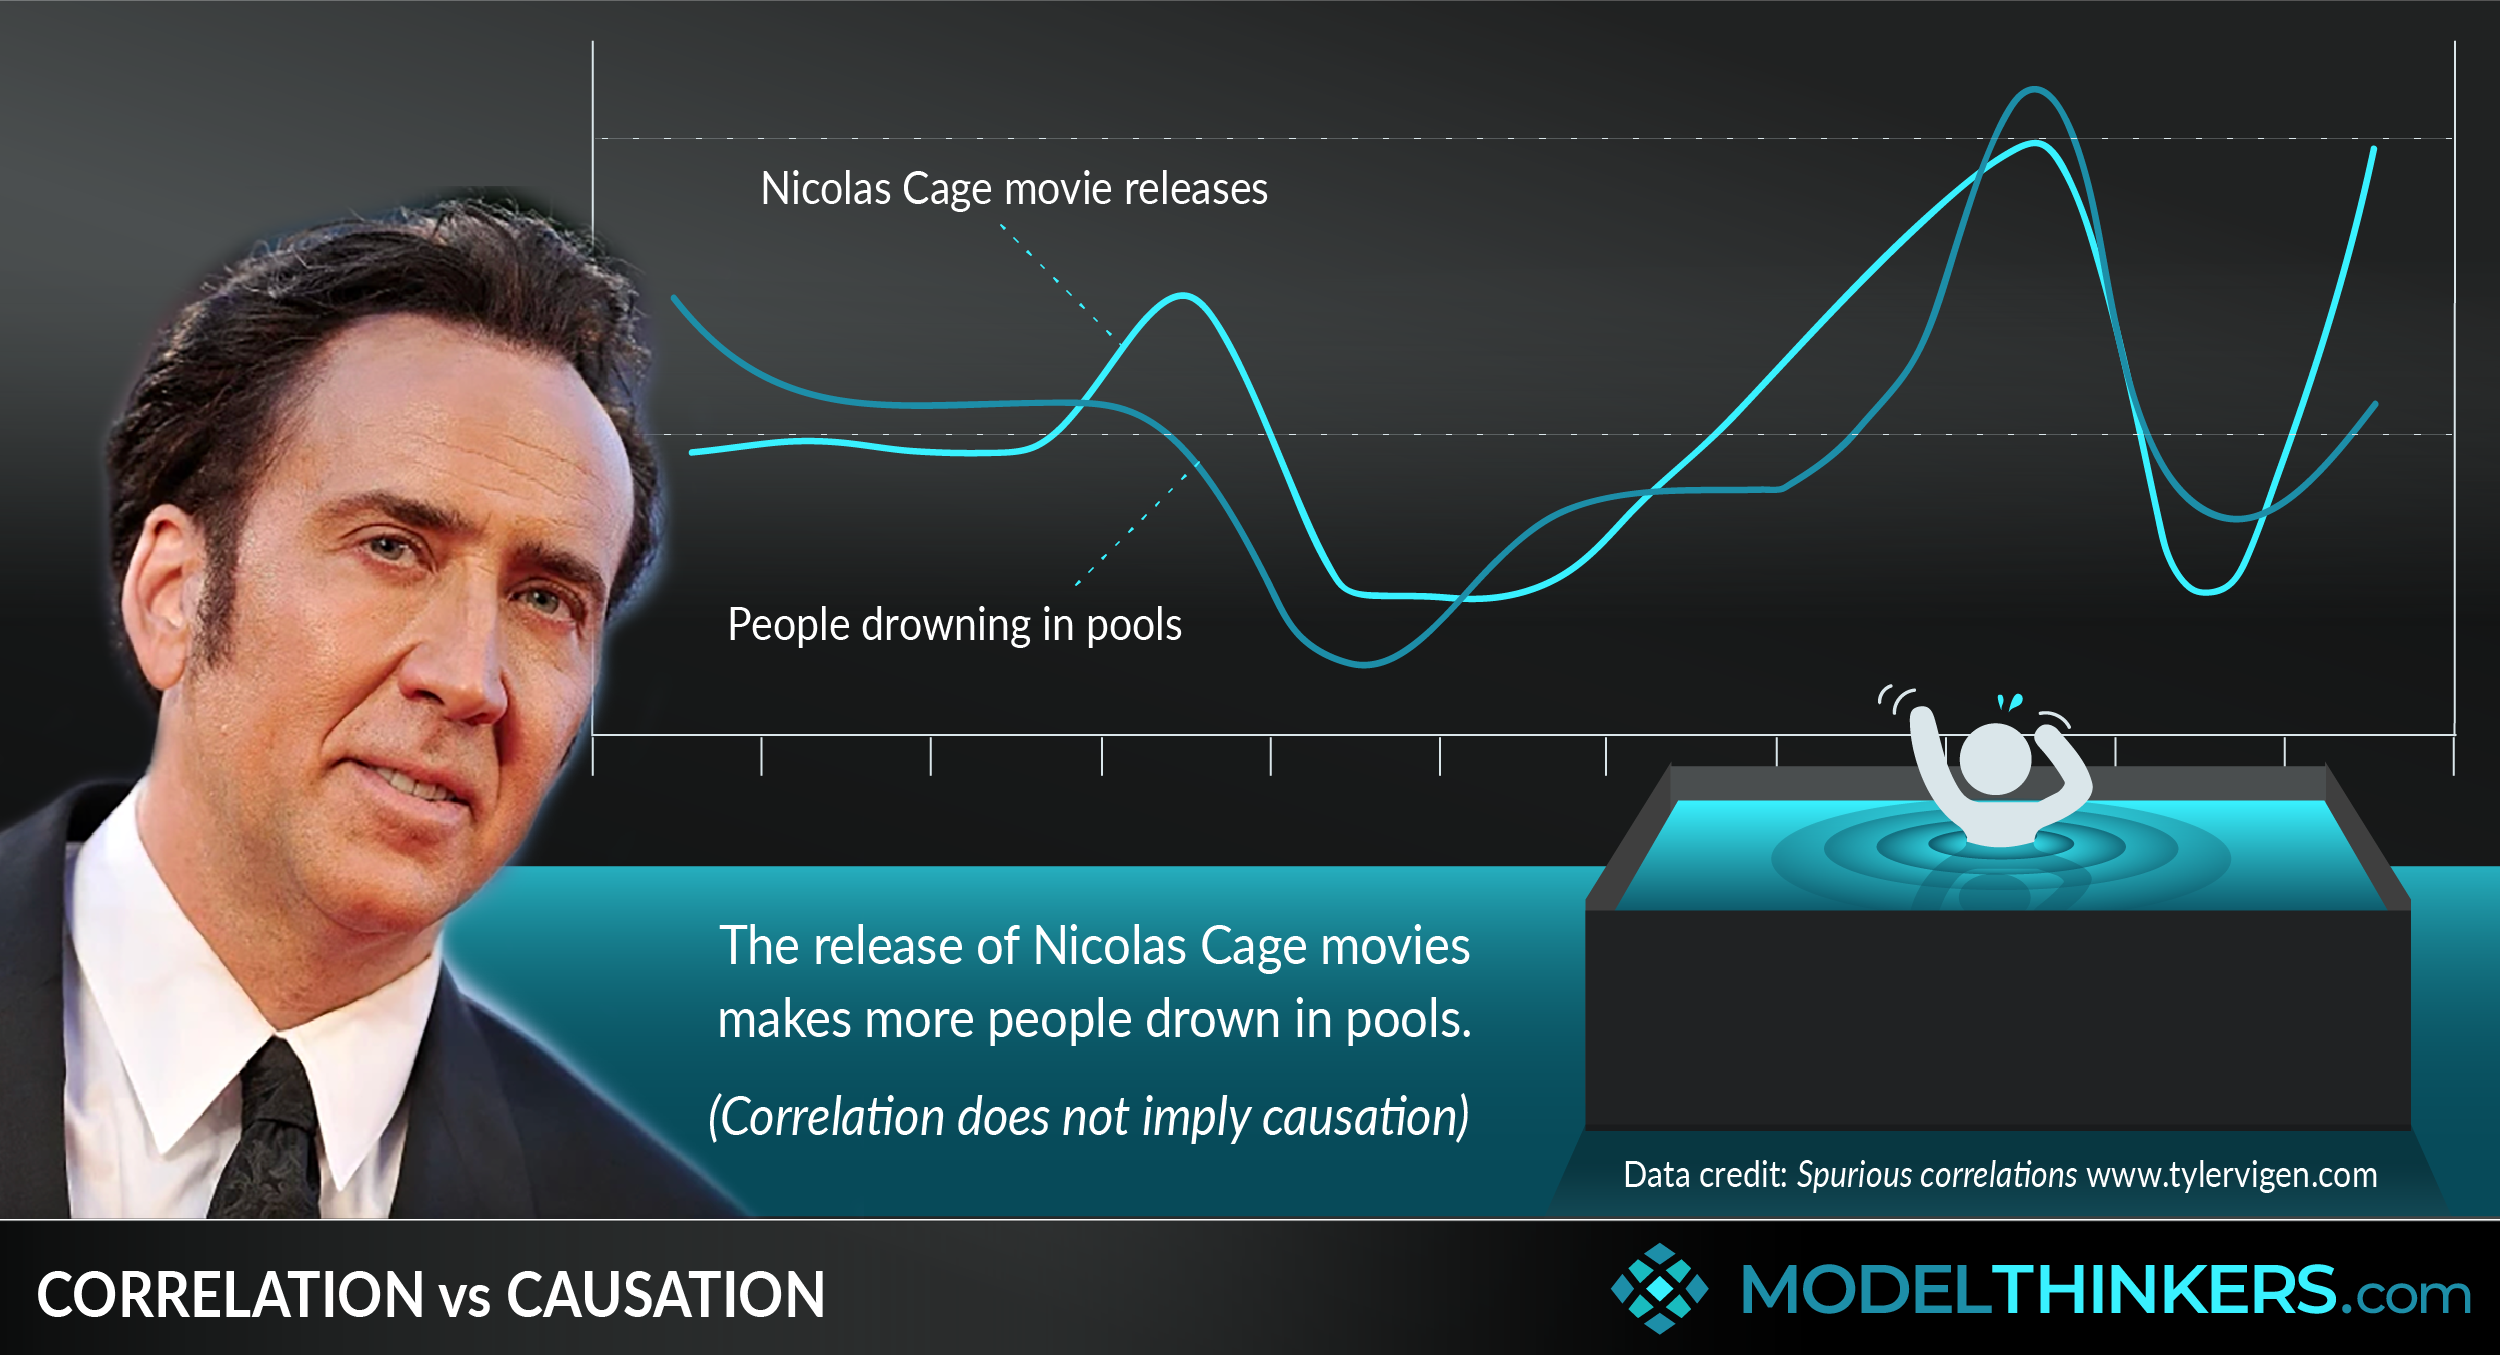
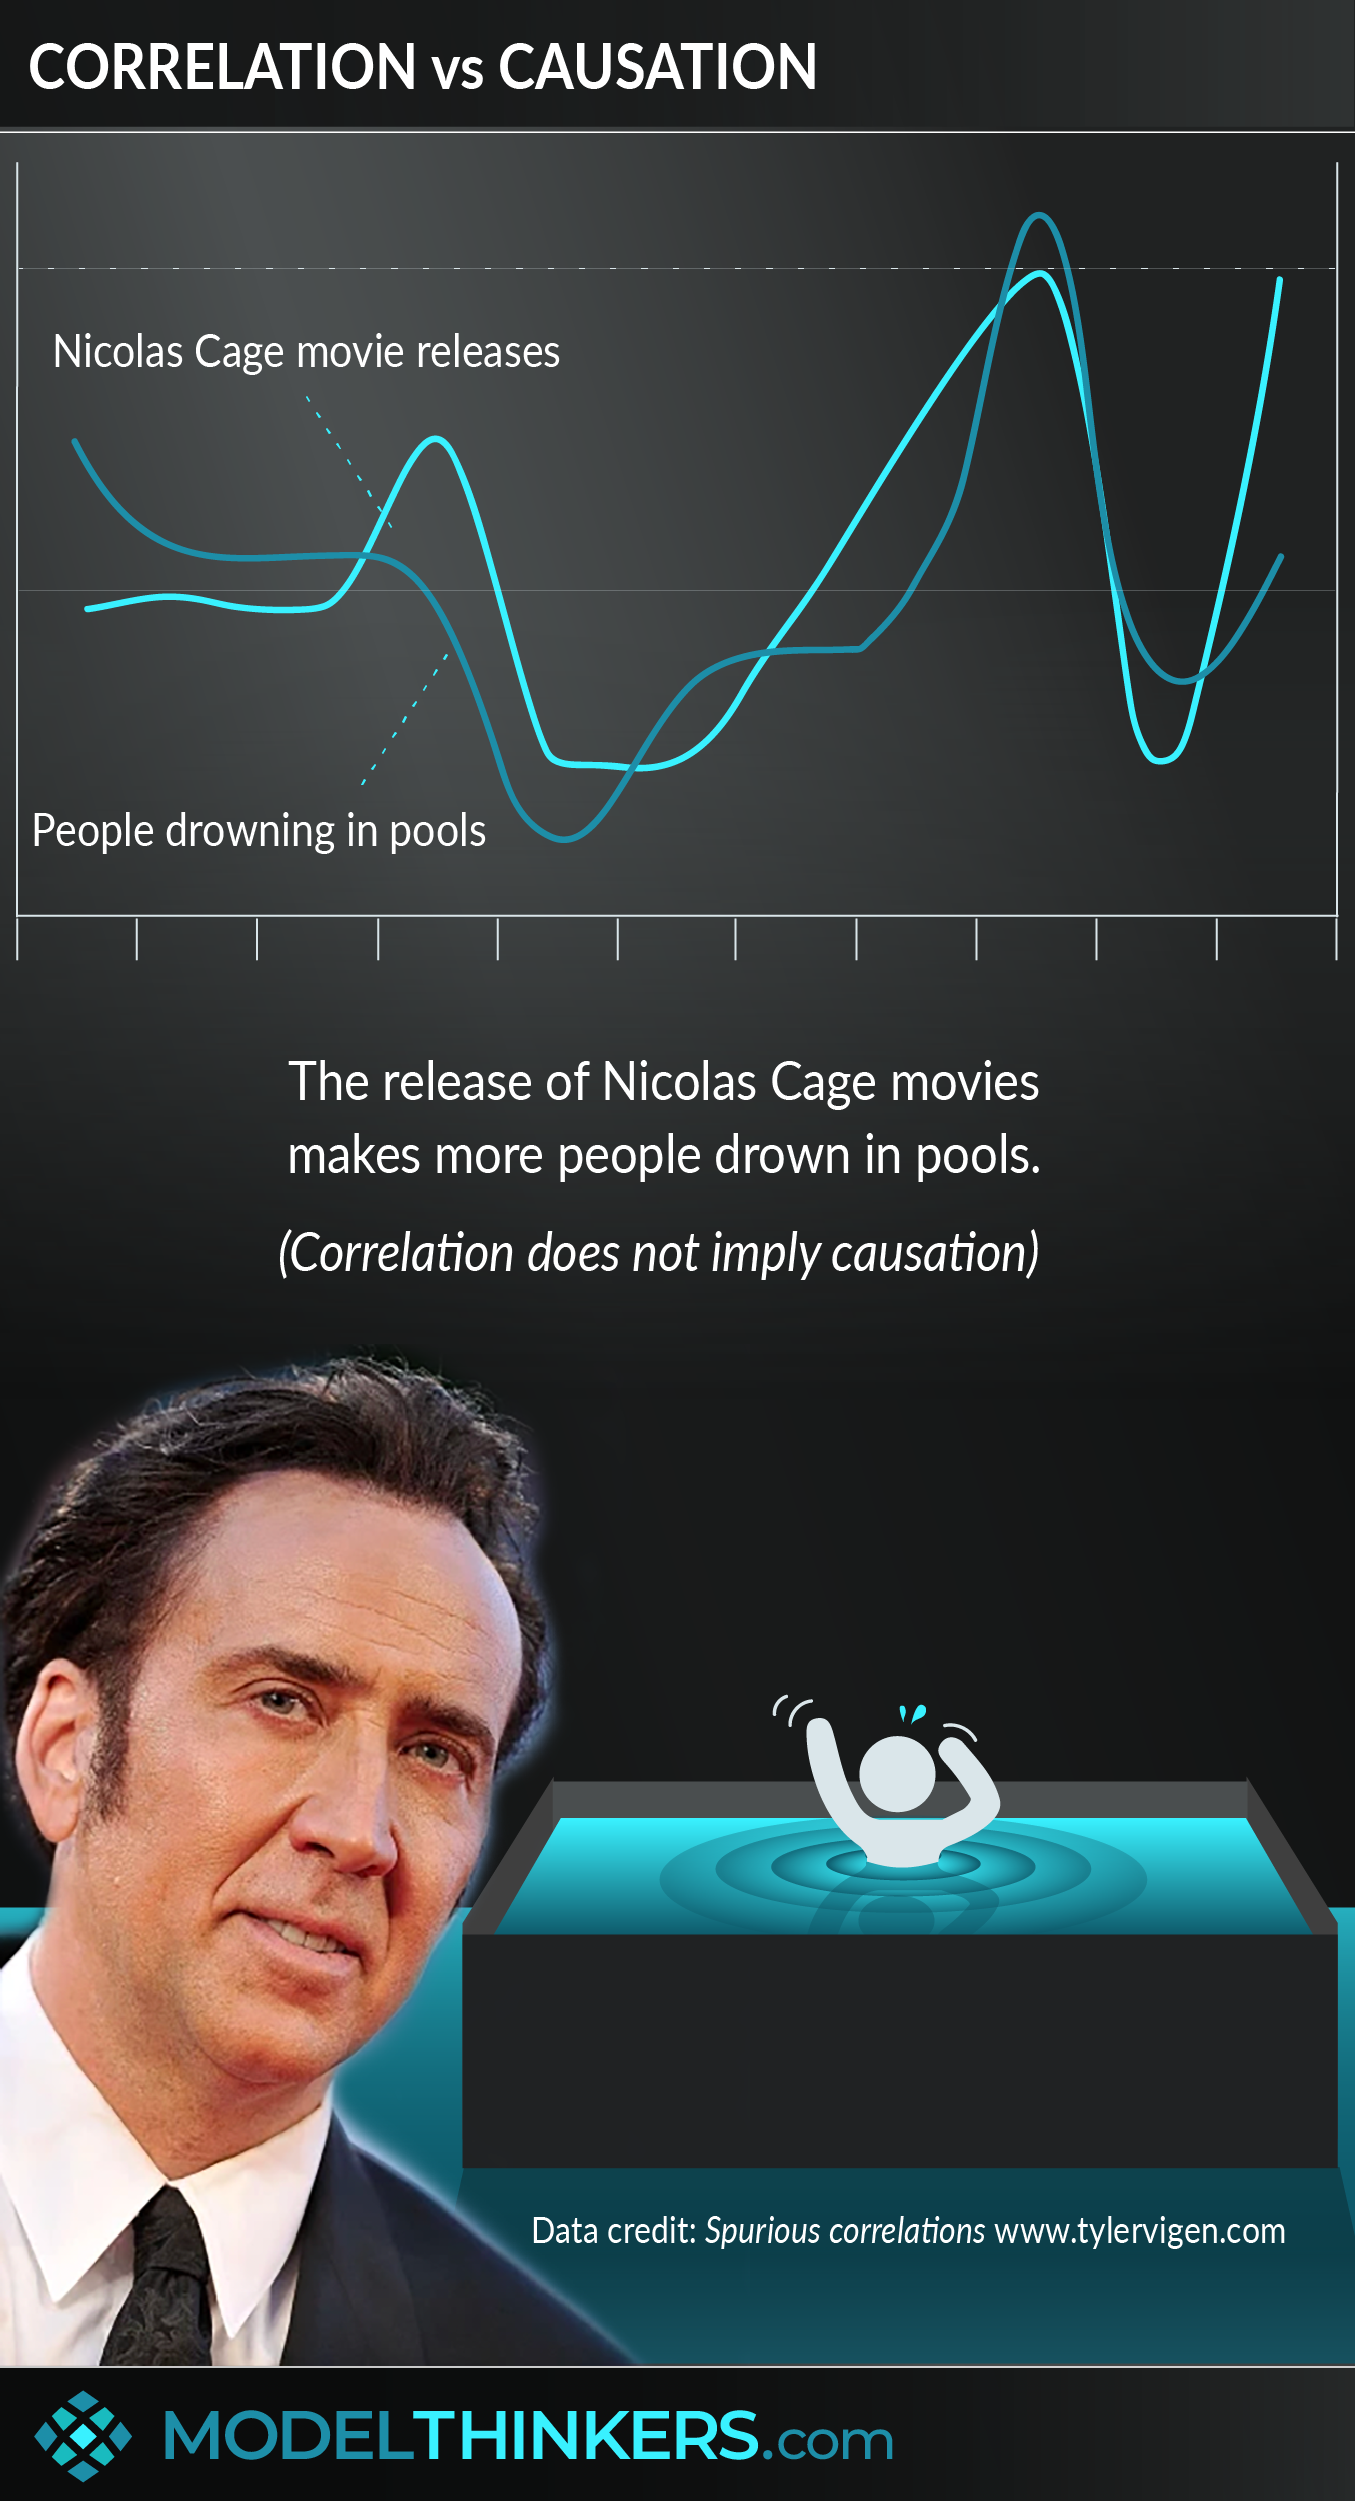
The release of Nicolas Cage movies makes more people drown in pools! We know, that’s a big claim, but we have the data to prove it. Information from the Centre for Disease Control & Prevention clearly demonstrates that the number of people who drown in pools is linked to Nicolas Cage movie releases. Actually, that might be a timely point to introduce this model...
Correlation is a positive or negative mirroring of statistical results between two variables, causation identifies a link or ‘cause and effect’ relationship between those variables. Importantly, correlation does not imply causation.
THE CAUSAL FALLACY.
An understanding of this model helps to interrupt the causal fallacy, also known as the questionable cause, where you falsely find meaning in chance. Specifically, you attribute causal relationships to correlated factors. It’s understandable, your desire to see patterns and create narratives as you attempt to find order and explain the world is admirable. However, it’s also important to view assumed cause and effect relationships as one hypothesis, and remain open to other options.
AN EXAMPLE AS EASY AS A, B, C.
For example, you might notice a correlation between A and B. Both A and B might move or grow in complete alignment (positive correlation) or, as A grows, B might diminish at a similar rate (negative correlation). At that point, you might consider several logical hypotheses:
-
A causes B.
-
B causes A.
-
A and B are linked or reinforce each other.
-
C, a third factor known as a confounder, causes both A and B.
-
The pattern between A and B is a coincidence.
-
There is a combination of some of the above factors at play.
IN YOUR LATTICEWORK.
Correlation versus causation is a fundamental model for Data Science and unconscious biases in Behavioural Economics. The Causal Fallacy is common when initial extreme variations are subject to Regression to the Mean and can be influenced by the Confirmation Heuristic.
It highlights the need to apply the Scientific Method to challenge and test your hypothesis. It also helps to use Probabilistic Thinking to have a more complex, flexible view of what is happening and why. Also, consider using the 5 Whys or the Fishbone Diagram to explore true causal relationships. View the Actionable Takeaways below for some strategies to accurately identify cause and effect.
-
Remember that correlation does not imply causation.
While tempting to attribute cause and effect relationships to any correlation, work to keep an open mind about alternative possibilities.
-
Apply the Scientific Method.
Work with hypotheses and test them to identify what is correlation and causation. This includes interrupting and being aware of the Confirmation Heuristic. This might include using Split Tests to gain more data.
-
Dig deeper into the data.
Consider your data set — what is its statistical significance, population size, ability to be replicated and consistency? In data science, a process of statistical inference is required to assess likely causality.
-
Consider coincidence as a possibility.
Consider the possibility of a coincidence and/or Regression to the Mean and attributing false causal factors.
-
Consider the possibility of other underlying causal factors.
Use models like the Fishbone Diagram or 5 Whys to explore other possible causal relationships behind your initial observations.
-
Apply a sense check.
Consider whether the assumed causal relationship is aligned with current thinking and logical foundations. Of course, this risks falling into the Confirmation Heuristic, but a check against current understanding will immediately flag new or exceptional issues that might require further data or investigation.


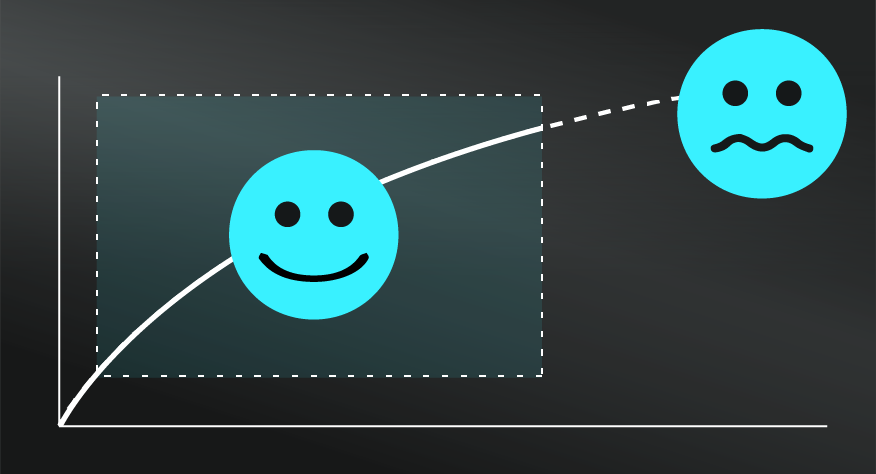
Applying this model to its extreme might include requiring extreme standards of evidence before identifying any causal relationships. This will potentially lead you to miss patterns and opportunities and prevent effective action as a result. Take this classic cartoon from the xkcb website:

Beyond the cartoon, consider how this model was used to argue against the health impacts of smoking. Particularly when large, wealthy vested interests are at risk of potential causal relationships (read, big tobacco), there can be many other claims that growing lung cancer is instead caused by better diagnostics or even increased pollution — and the onus of proving causation can be almost insurmountable. The evidence to prove human activity impact on climate change has faced a similar uphill battle.
When people eat ice cream they want to wear sunglasses.
This is an example of a causation fallacy. Data does show a correlation between ice cream and sunglasses sales, however, there is an obvious third factor that is most likely to be the causal factor behind both of these elements. Sunny days!
Windmills generate wind.
The statement above is an example of reverse causation. Wind obviously makes windmill blades turn, however an observer might hypothesise that when windmills are ‘working hard’ they generate more wind.
The Sports Illustrated curse.
See our summary of regression to the mean and the memorable story of the Sports Illustrated curse for successful sports teams.
So many examples.
Spurious correlations by Tyler Vigen does a remarkable job of making this point with countless examples. It’s well worth your time to explore more.
Correlation versus causation is a fundamental model for data science and unconscious biases in behavioural economics.
Use the following examples of connected and complementary models to weave correlation versus causation into your broader latticework of mental models. Alternatively, discover your own connections by exploring the category list above.
Connected models:
-
Regression to the mean, as a common point that drives the causation fallacy.
- Probabilistic thinking: having a more complex view on likely causal relationships and potential patterns.
Complementary models:
- Fishbone diagram and 5 whys: in establishing acutal causal relationships.
- Scientific method and split testing: in testing hypotheses.
The phrase ‘correlation does not imply causation’ is a model from data science that has been broadly popularised, particularly over the last few decades in frustrating internet-based arguments. It is believed to have originated in the 1800s - with thinkers such as Auguste Bravais who published a paper on the statistical concept of correlation in 1844, and Francis Galton, whose work introduced the correlation coefficient to measure the degree of correlation. However, Karl Pearson, a British statistician, has been credited with building on this work and has become known as a key proponent of the correlation coefficient, often being credited with its invention.
We’ve left the attribution to this model blank because it is even more unclear than usual to point to a particular thinker or historical figure who first said it. Happy to be corrected — so let us know if you have more information on its origins.
In terms of resources, if you’re prepared to waste the rest of the day, please visit Spurious Correlations, the wonderful site by Tyler Vigen.
 My Notes
Oops, That’s Members’ Only!
Fortunately, it only costs US$5/month to Join ModelThinkers and access everything so that you can rapidly discover, learn, and apply the world’s most powerful ideas.
ModelThinkers membership at a glance:

“Yeah, we hate pop ups too. But we wanted to let you know that, with ModelThinkers, we’re making it easier for you to adapt, innovate and create value. We hope you’ll join us and the growing community of ModelThinkers today.”
You Might Also Like:
- Actionable summaries of the world's most powerful ideas.


Subscribe now and download this practical guide to transform your thinking, plus recieve one short, powerful and actionable idea in your inbox each month.